Child Care Market Overview, Trends, Growth and In Dept Insights 2025

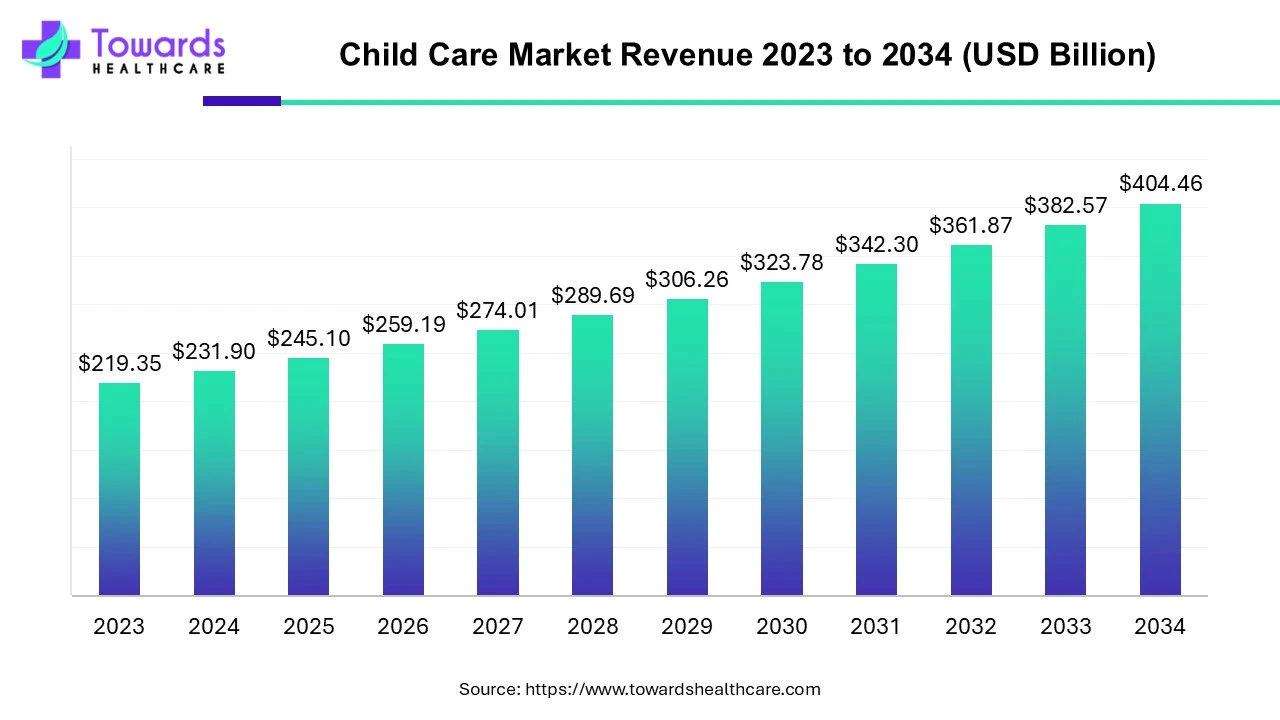
The global child care market was valued at US$ 231.90 billion in 2024 and is projected to reach US$ 245.10 billion in 2025. Over the next decade, it is expected to expand significantly, hitting US$ 404.46 billion by 2034, reflecting a CAGR of 5.72% (2025–2034). The U.S. child care market alone was worth US$ 59.87 billion in 2023, with an estimated rise to US$ 88.22 billion by 2033, growing at 4.3% CAGR. Growth is fueled by increasing working parents, urbanization, rising disposable income, government support, and AI-driven innovation.
Download the free sample and get the complete insights and forecasts report on this market @ https://www.towardshealthcare.com/download-sample/5248
Table of Contents
ToggleMarket Size
Global Market
2024: US$ 231.90 B
◉Context: Post-pandemic stabilization with accelerating formalization (shift from informal/home-based sitters to licensed providers).
2025: US$ 245.10 B
◉YoY Δ 2024→2025: +US$ 13.20 B (+5.7%), in line with structural CAGR.
2034: US$ 404.46 B
◉Total absolute growth 2025→2034: +US$ 159.36 B.
◉Average yearly incremental addition (2025–2034): US$ 17.7 B/year (not uniform—front-loaded by policy and capacity expansions in APAC).
CAGR (2025–2034): 5.72%
◉What drives the CAGR: working-parent growth, organized facility penetration, tech-enabled capacity utilization, and public subsidies.
Sensitivity:
◉Execution-heavy markets (e.g., capacity, workforce accreditation) sustain the CAGR.
◉Regulatory/talent bottlenecks could shave ~0.5–1.0 pp if unresolved; AI/ops tech can offset.
U.S. Market
◉2023: US$ 59.87 B
◉2033: US$ 88.22 B
◉CAGR (2024–2033): 4.3%
◉Absolute growth (2023→2033): +US$ 28.35 B (US$ 2.8 B/year avg).
◉Context: structural demand from dual-income households and single-parent families; supply expansion tempered by licensing, wages, and real estate costs.
Leading Region (2023)
◉North America dominated due to high working-parent prevalence, single-parent households, and corporate childcare integrations.
◉Implication: pricing power higher; policy tailwinds (city/state subsidies) reduce price sensitivity.
Fastest Growing Region
vAsia Pacific—population density, rapid urbanization, and rising female labor participation.
◉Implication: largest new-build capacity; tech-first operating models (mobile-native parent engagement, digital payments) scale quickly.
Market Trends
AI Integration into Child Care
◉Kangarootime × Clay (2024): AI-driven personalized curriculum, behavioral/developmental support, staff coaching.
◉Operator angle: boosts classroom productivity and learning/outcome reporting, enabling premium pricing for enriched programs.
◉Investor angle: software attach rates increase lifetime value (LTV) and reduce churn.
Real-time monitoring (sensors/cameras/analytics):
◉Value: immediate safety alerts; automated ratio checks; digital incident logs; compliance evidence trails.
◉Risk: strict data privacy governance required (consent, retention, auditability).
Consolidation through Acquisitions
◉Roper Technologies (2024) → Procare Software (US$ 1.75 B): deepens footprint in cloud-based center management (billing, rostering, parent comms).
◉Implication: standardization of best practices; ecosystem effects (integrations with payroll, attendance, CAC solutions).
Corporate Support Programs
◉Goldman Sachs (2024): Back-Up Care Programme with up to 20 days per dependent.
◉Implication: corporate-sponsored demand is sticky and counter-cyclical; supports expansion of backup/emergency care category.
Government Investment in Childcare
◉NYC (2024): +US$ 100M → US$ 3B FY25 childcare/early ed budget.
◉Canada (Budget 2021): US$ 27B+ multi-year commitment to universal childcare (+additional funds to US$ 30B).
◉World Bank (2024): US$ 180M to LMICs for affordable childcare.
◉Implication: subsidies accelerate formalization, capacity build-out, and affordability—especially for infants and low-income families.
IPO & Private Equity Funding
KinderCare (2024): planned US$ 600M raise; midpoint valuation US$ 2.9B.
◉Implication: capital for new sites, curriculum content, and tech stack; signals investor confidence in recurring revenue model.
◉Foresight Group (2024): £5M into UK childcare/edutainment assets.
◉Implication: hybrid models (learning + play + care) to monetize longer dayparts/weekends.
Deep Role of AI in the Child Care Market (granular levers & KPIs)
Operational Efficiency
◉Automated rostering (optimize child-to-staff ratios by age block), attendance, waitlist management, invoicing/collections.
◉KPIs impacted: staff utilization (+3–7 pp), DSO (days sales outstanding) ↓, administrative hours per classroom ↓ 20–35%.
Child Safety & Monitoring
◉Computer vision flags wandering, falls, restricted-area entry, sleep posture for infants; instant alerts to staff.
◉KPIs: incident response time ↓ 50–80%; documented compliance ↑; liability exposure ↓.
Personalized Learning
◉BMC (Boost My Child, 2024): AI-aligned to NCF/NEP, ages 0–8—adaptive activities by learning domain (language, numeracy, socio-emotional, motor).
◉KPIs: curriculum coverage ↑; objective milestone tracking; parent-reported satisfaction ↑.
Parent Engagement
◉AI chatbots for FAQs, schedules, policy updates; push notifications for meals, naps, learning highlights.
◉KPIs: response SLAs ↓; engagement rates ↑ (open/clicks); referrals/NPS ↑.
Predictive Analytics
◉Early detection of speech delays, sensory issues, or behavioral concerns—triage to specialists.
◉KPIs: earlier interventions; retention ↑ for children with additional needs; quality ratings ↑.
Staff Development & Retention
◉AI coaching: micro-feedback on classroom management, tone, activity pacing.
◉KPIs: turnover ↓; training hours targeted; center quality audits improve.
Revenue & Pricing Uplift
◉Tiered offerings (standard vs. AI-enriched curriculum/safety), backup-care monetization, extended hours with automated scheduling.
◉KPIs: ARPU ↑; capacity utilization ↑; margin expansion despite wage pressures.
◉Guardrails: privacy-first design, explicit opt-ins, regional data residency, bias testing for learning analytics, explainability in parent reports.
Regional Insights
North America (Leading Region)
Demand Drivers
◉Dual-income and single-parent households (~15.09M children with single mothers, 3.05M with single fathers in 2023).
◉Corporate backup-care and on-site care benefits expanding.
Supply & Policy
◉NYC’s US$ 3B FY25 plan ↔ seats for infants/toddlers + special ed preschool funding.
◉Credentialing standards ensure quality but cap supply velocity.
Operating Model Nuances
◉Premium pricing possible where subsidy gaps persist; AI can offset wage inflation via scheduling & admin automation.
Strategic Opportunities
◉Hub-and-spoke networks (flagship + satellites), flex-hour programs for non-traditional shifts, partnerships with large employers.
Asia Pacific (Fastest Growing)
Macro
◉Largest child population, rapid urban migration, rising female labor participation.
China
◉75k+ centers, capacity for 3.6M under-3s; 4.77M slots by end-2023; “Mama’s Posts” enable flexible work for mothers.
India/Japan/South Korea
◉India: massive formalization runway; digital payments and app engagement accelerate adoption.
◉Japan/Korea: aging societies but high workforce participation, demand for reliable infant/toddler care & after-school programs.
Strategic Opportunities
◉Greenfield builds with AI-native ops; multi-lingual curricula; public-private pilots in urban clusters.
Europe (Regulated & Quality-Focused)
System Design
◉Public financing, strict quality standards, professional qualifications for staff; cross-country variance (Nordics vs. Med models).
Germany
◉Emphasis on caregiver credentials, structured pedagogy; slower growth but predictable reimbursement.
Strategic Opportunities
◉Value-added services around core state-funded hours (extended day, STEAM, languages), and work-life solutions for employers.
Latin America & MEA
LATAM (Brazil/Mexico/Argentina)
◉Urbanization + rising middle class; mix of private tuition and NGO/state support; potential for affordable organized facilities.
Middle East (UAE/Saudi/Kuwait)
◉Policies encouraging women’s workforce participation; premium bilingual programs; strong safety/compliance expectations.
Strategic Opportunities
◉Franchise expansion with standardized QA; corporate tie-ups for backup care; digital parent engagement to build trust.
Market Dynamics
Drivers
◉Working-parent growth & nuclear families → sustained demand for organized care.
◉Rising disposable incomes → higher willingness to pay for safety + enrichment.
◉AI & digitization → better utilization, parent transparency, regulatory readiness.
◉Government initiatives → NYC + Canada + World Bank unlock access & capacity.
◉Child population growth → projected +24% (2022–2042) increases future need.
Restraints
◉Regulatory complexity (ratios, certifications, safety, curriculum) → slower time-to-open and higher fixed costs.
◉Workforce constraints → wage inflation, turnover; quality jeopardized without robust training.
Opportunities
◉Infant care (fastest-growing) → premium positioning with strong safety tech.
◉School-age care → before/after school, summer, and weekend slots monetize existing real estate.
◉AI/EdTech → new SKUs (developmental analytics, personalized curricula, tele-consults for parents).
◉Corporate & municipal partnerships → predictable occupancy and anchor funding.
Risks & Mitigations
◉Privacy concerns → transparent policies, data minimization, SOC-type controls.
◉Funding cyclicality → diversify payor mix (parent-pay + corporate + public).
◉Real estate costs → hub-and-spoke models, shared facilities with schools/community centers.
Top Companies
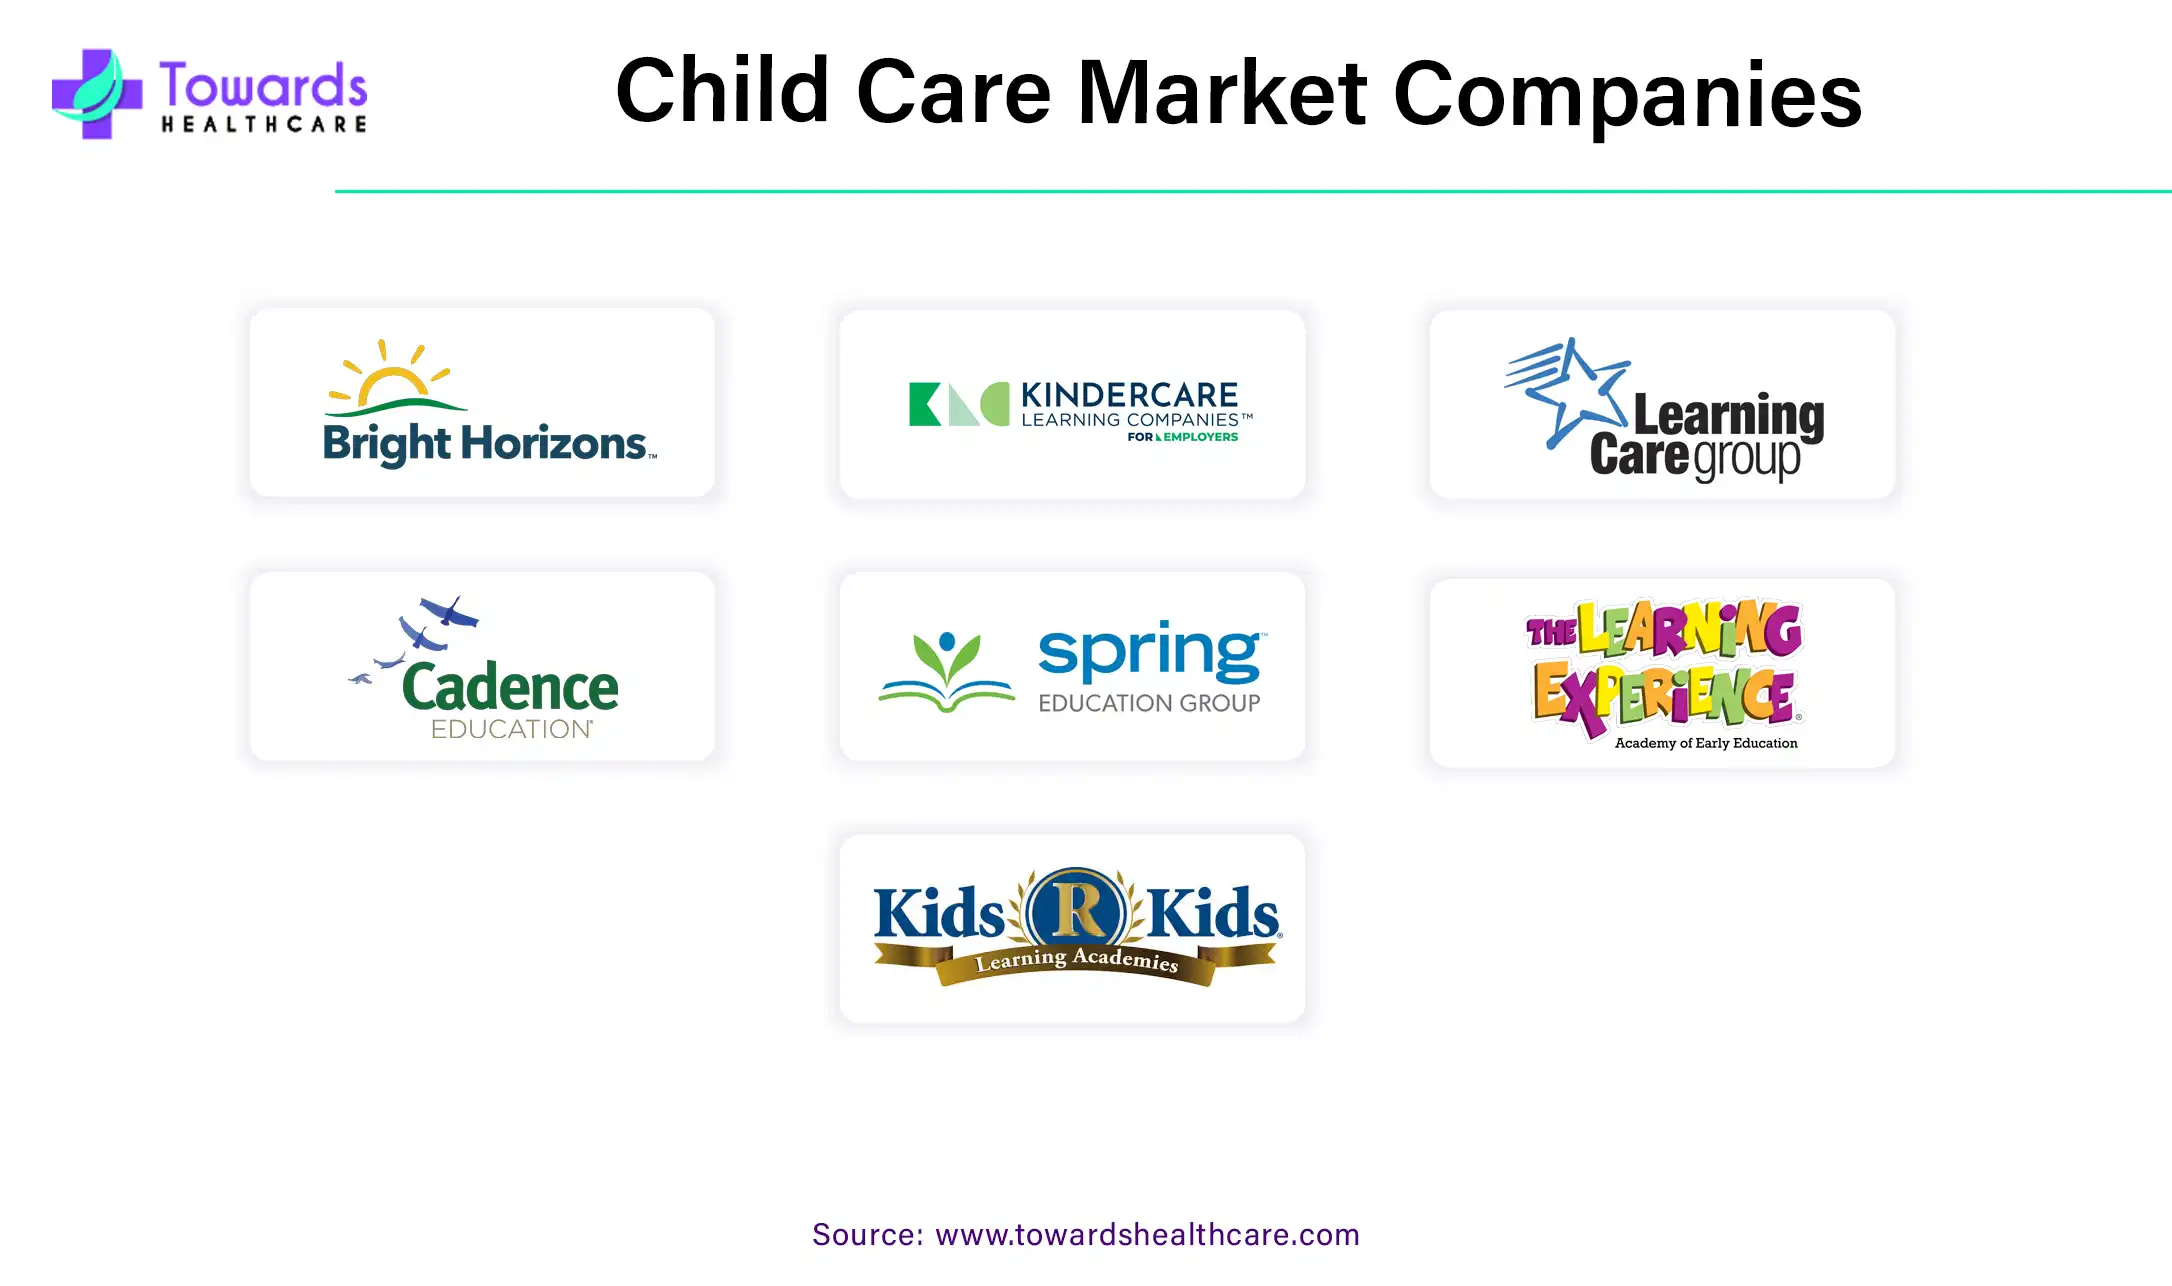
1 Bright Horizons Family Solutions
◉Products/Services: Employer-sponsored centers, full-service early education, backup care, family support.
◉Overview: Global pioneer in workplace-integrated childcare.
◉Strengths: Enterprise contracts, brand trust, sophisticated ops/QA, strong parent engagement platforms.
2 KinderCare Learning Centers LLC.
◉Products/Services: U.S. network of early learning centers, curriculum-based programs, extended hours.
◉Overview: Largest U.S. private provider.
◉Strengths: Scale, standardized curricula/ops; 2024 IPO plan (US$ 600M, ~US$ 2.9B midpoint valuation) enables growth capex and tech.
3 Care.com
◉Products/Services: Marketplace for caregivers (nannies, sitters, tutors), background checks, payment tools.
◉Overview: Digital platform bridging supply–demand for in-home care.
◉Strengths: Tech reach, flexibility, low asset intensity; complements organized facilities via backup care.
4 Goodstart Early Learning (Australia)
◉Products/Services: Center-based early learning and care, developmental programs.
◉Overview: Large non-profit network focused on child outcomes.
◉Strengths: Mission-led quality, reinvestment into programs, community trust.
5 Learning Care Group, Inc.
◉Products/Services: Multi-brand portfolio (diverse curricula), center management at scale.
◉Overview: One of the largest North American operators.
◉Strengths: Brand segmentation, geographic spread, data-driven ops.
◉Also notable: Cadence Education, Primrose Schools, Goddard Systems, BrightPath Kids, Winnie, NeighborSchools, New Horizon Academy, Childcare Network, Spring Education Group, The Learning Experience, Kids ‘R’ Kids, Fortune Kindergarten, SitterTree, LLC.
Latest Announcements
◉Christopher Angellata (2024) → CEO, Ohio Child Care Resource & Referral Association
◉Implication: State-level ecosystem strengthening—training, resources, and provider guidance → quality uplift and capacity alignment.
◉NYC 10-Point Plan (2024): +US$ 100M (total US$ 3B in FY25) for early childhood & special ed preschool.
◉Implication: Seat creation in high-need zip codes, improved affordability, better inclusion for children with special needs; demand spillover to private operators partnering with the city.
Recent Developments
Iowa’s Child Care Connect (C3, 2024)
◉What it does: Visualizes demand vs. supply by region to target interventions.
◉Operator payoff: Smarter site selection, staffing plans; reduces vacancy or waitlist imbalances.
World Bank (2024): US$ 180M for affordable childcare in LMICs
◉Payoff: Catalyst for formalization, women’s labor participation, and child outcomes—accelerates APAC/MEA growth pockets.
KinderCare IPO (2024)
◉Payoff: Fuel for network expansion, program innovation, and technology upgrades; sector signaling event for capital markets.
Foresight Group (2024): £5M into UK facilities/edutainment
◉Payoff: Blended models (care + enrichment/play) to maximize utilization and ticket diversity.
Investment & Funding Insights in the Global Child Care Market
◉The child care industry is undergoing rapid institutionalization and financialization, with private equity, venture capital, corporate investments, and government funding playing pivotal roles in reshaping its growth trajectory.
Private Equity & Venture Capital Funding
Major PE Investments
◉Foresight Group (UK, 2024) → £5M investment into expanding childcare and early education facilities.
◉KKR & Bain Capital → Historically active in U.S. daycare acquisitions, consolidating fragmented childcare centers into scalable networks.
◉Warburg Pincus & Partners Group → Strong interest in edtech-integrated childcare models, with backing for hybrid learning platforms.
Emerging VC-Backed EdTech & AI Startups
◉Boost My Child (2024, India) → Raised Series A funding to expand AI-driven curriculum personalization.
◉Kangarootime → Acquisition of Clay (2024) demonstrates investor appetite for AI-enabled platforms.
◉Winnie Inc. → U.S.-based marketplace for daycare discovery has received multiple VC rounds to expand tech-driven childcare search and enrollment.
Corporate Investments & IPO Activity
KinderCare IPO (2024)
◉Raised US$ 600M, valuing the company at US$ 2.9B.
◉Proceeds targeted towards expansion of early education centers and digital transformation of operations.
◉First major childcare IPO post-pandemic, signaling renewed investor confidence in the sector.
Roper Technologies Acquisition of Procare Software (2024)
◉Deal Size: US$ 1.75B.
◉Significance: Strengthens Roper’s presence in childcare management SaaS, automating billing, scheduling, compliance, and parent communication.
Goldman Sachs Corporate Program (2024)
◉Launched a Back-Up Care Program offering 20 days of priority care per dependent annually.
◉Represents a corporate welfare investment trend, where firms directly finance childcare services to retain talent.
◉Insight: Corporates are increasingly investing in childcare solutions as employee benefits, driving workplace-based childcare partnerships.
Government & Developmental Investments
United States
◉New York (2024): US$ 100M increase → Total childcare budget reaches US$ 3B FY25.
◉Federal Head Start & Child Care Development Fund (CCDF) → Multi-billion-dollar programs to subsidize childcare for low-income families.
Canada
◉Budget 2021: US$ 27B+ pledged towards universal $10-a-day childcare across provinces.
◉Goal: Support labor force participation of women and reduce childcare burden.
China
◉Mama’s Posts Policy (2023–24) encourages creation of childcare posts to support working mothers.
◉Subsidies for building licensed childcare facilities in Tier-1 & Tier-2 cities.
World Bank & Global Development Programs
◉World Bank Initiative (2024): US$ 180M to support affordable childcare programs in developing nations.
◉Focus: Latin America, Africa, and South Asia → Expand community-based childcare and improve child safety standards.
◉Insight: Governments view childcare not only as a social welfare service, but also as a labor market productivity tool, driving major public financing.
Regional Investment Dynamics
◉North America → Dominated by PE-led acquisitions, corporate childcare programs, and public funding (NYC, federal).
◉Asia Pacific → Investments focused on capacity expansion (China, India) and AI integration (Japan, South Korea).
◉Europe → Strongly public-financed, but private players expanding in premium segments (Germany, UK, Nordics).
◉Latin America & MEA → Early-stage growth, with PE funds and World Bank support entering to address supply gaps.
Key Market Trends in Investment
◉Shift from Standalone Facilities → Scalable Chains → Investors prefer multi-location networks (Bright Horizons, KinderCare).
◉Rise of Tech-Enabled Platforms → AI, IoT, and SaaS-driven childcare systems attract VC funding.
◉Corporate-Childcare Partnerships → Firms directly investing in childcare to retain employees (Goldman Sachs, Amazon, Google).
◉Blended Education + Care Models → Growing capital inflows into edtech-integrated child care (AI-based curriculum, gamified learning).
◉Sustainability & ESG-Driven Investments → Investors prioritizing child safety, inclusivity, and accessibility in funding decisions.
Future Outlook for Investments
◉PE/VC Activity → Likely to grow in Asia-Pacific, targeting the large unmet demand in urban centers.
◉IPO Wave → More large childcare operators (Learning Care Group, Bright Horizons) may explore IPOs within 5 years.
◉AI Startups → Expect higher VC funding in AI-driven childcare management, predictive analytics, and parent engagement tools.
◉Government Spending → Anticipated increase in U.S., Canada, and EU public childcare budgets → long-term stability for operators.
◉Impact Investments → ESG funds will focus on inclusive childcare access in low & middle-income countries.
Segments Covered
By Type
Early Education & Daycare (Largest/Fastest)
◉Why it leads: school readiness outcomes, structured curricula, measurable milestones.
◉Success levers: certified staff, strong parent reporting, AI-supported planning.
Early Care
◉Focus: safe, nurturing environment for daily routines.
◉Levers: safety tech, hygiene protocols, caregiver stability (low turnover).
Backup Care
◉Focus: episodic, short-notice coverage (illness, school closures, travel).
◉Levers: corporate partnerships, flexible staffing pools, app-based booking.
Others
◉Examples: language immersion, special-needs support, enrichment clubs.
◉Levers: specialist staff, partner therapists, higher ASPs via niche value.
By Delivery
Organized Care Facilities (Dominant/Fastest)
◉Edge: standardized quality, economies of scale, audit-ready compliance.
◉AI role: rostering, incident analytics, digital QA trails.
Home-Based Settings
◉Edge: intimacy, flexible hours, neighborhood trust.
◉Risk: variable quality; platforms (e.g., Care.com, neighborhood networks) can professionalize operations.
By Age Group
School-Aged Children (Largest)
◉Programs: before/after school, homework clubs, summer camps.
◉Levers: transport logistics, STEAM/arts coding clubs to lift ARPU.
Infants (Fastest-Growing)
◉Needs: high staff ratio, strict safety, sleep/feeding tracking.
◉Levers: premium pricing, AI sleep monitoring, parent dashboards.
Toddlers
◉Focus: motor skills, language bursts, social routines.
◉Levers: structured play, sensory activities, parent coaching modules.
Pre-schoolers
◉Focus: pre-literacy/numeracy, socio-emotional growth, school readiness.
◉Levers: evidence-based curricula, milestone reporting, transition-to-school packs.
By Region
◉North America, Europe, Asia Pacific, Latin America, MEA—(see regional section for detailed strategies).
Operator & Investor Playbook
◉Capacity Strategy: prioritize infants (premium, sticky), then school-age (utilize downtime/after-hours).
◉Tech Stack: adopt center management + AI analytics + parent comms; ensure privacy governance.
◉Go-to-Market: blend corporate contracts (backup care) with consumer acquisition (local SEO, referrals).
◉People Model: continuous training + AI micro-coaching; career ladders to reduce churn.
◉Policy Interface: align with subsidy programs (NYC/Canada) to widen addressable demand.
◉Risk Controls: document everything (incident logs, ratios, inspections); audit readiness is a moat.
Top 5 FAQs
What is the size of the global child care market?
→ Valued at US$ 231.90B in 2024, projected to hit US$ 404.46B by 2034, CAGR 5.72%.
Which region dominates the child care market?
→ North America leads due to high working parent population and government support.
Which age group is growing fastest in child care demand?
→ Infants segment, due to nuclear families and rising birth rates.
What role does AI play in child care?
→ Enhances safety, personalization, parent engagement, staff training, and predictive analytics.
Who are the top players in the child care market?
→ Key players include Bright Horizons, KinderCare, Care.com, Learning Care Group, Goodstart Early Learning, Primrose Schools, Goddard Systems.
Check out the details below
Access our exclusive, data-rich dashboard dedicated to the healthcare market – built specifically for decision-makers, strategists, and industry leaders. The dashboard features comprehensive statistical data, segment-wise market breakdowns, regional performance shares, detailed company profiles, annual updates, and much more. From market sizing to competitive intelligence, this powerful tool is one-stop solution to your gateway.
Access the Dashboard: https://www.towardshealthcare.com/access-dashboard
Immediate Delivery Available | Buy This Premium Research @ https://www.towardshealthcare.com/price/5248
Become a valued research partner with us – https://www.towardshealthcare.com/schedule-meeting
You can place an order or ask any questions, please feel free to contact us at sales@towardshealthcare.com
Powering Healthcare Leaders with Real-Time Insights: https://www.towardshealthcare.com/healthcare-intelligence-platform
Europe Region – +44 778 256 0738
North America Region – +1 8044 4193 44
Web: https://www.towardshealthcare.com
Find us on social platforms: LinkedIn | Twitter | Instagram | Medium | Pinterest