

Gene Therapy Clinical Trials Market Growth, Dynamics and Regional Growth 2025

Market Size
Overall Growth
◉Forecasts suggest hundreds of millions of dollars in revenue between 2025–2034.
◉Growth supported by regulatory approvals, clinical trial expansions, and strong pipelines.
North America (46% Share in 2024)
◉Dominated global market due to advanced infrastructure, investments, and large patient base.
◉Expansion of manufacturing and logistics supporting scale-up.
Asia-Pacific (Fastest CAGR)
◉Rising clinical trial activity, lower operational costs, government backing.
◉Countries like China, Japan, and India boosting capacity.
Europe
◉Strong biotech ecosystem, supportive regulations, growing cell & gene therapy ecosystem.
◉Germany, UK, and France are central hubs.
Latin America, MEA
◉Early-stage adoption, growing collaborations.
◉Brazil and UAE increasing investments.
Market Trends
Collaborations as Growth Strategy
◉Biogen & Stoke Therapeutics partnership (2025) for zorevunersen in Dravet syndrome.
◉BRIC-inStem & CMC Vellore launched India’s first hemophilia gene therapy trials (2025).
Therapy Modality Shift
◉In vivo therapy dominated 55% share in 2024 due to simplicity.
◉Ex vivo expected fastest growth for highly personalized therapies.
Vector Platform Preference
◉AAV vectors held 45% market share in 2024 (non-pathogenic, non-integrating).
◉Genome editing (CRISPR, TALEN, ZFN) expected fastest CAGR.
Therapeutic Area Movement
◉Oncology dominated (35% share in 2024).
◉Neurology/CNS showing fastest CAGR as awareness and early diagnosis improve.
Clinical Trial Phases
◉Phase I/II held 60% share (early safety testing).
◉Phase III expected to see sharp growth, critical for regulatory approvals.
Route of Administration
◉Intravenous/systemic led with 40% share (fast onset, high bioavailability).
◉Intrathecal/CNS expected fastest CAGR for neurological therapies.
Role of AI in Gene Therapy Clinical Trials
Patient Recruitment & Selection
◉AI-driven predictive models help identify eligible patients from large genomic databases.
◉Reduces recruitment delays by screening for rare disorders faster.
Trial Monitoring & Automation
◉AI enables real-time monitoring of patient safety and biomarkers.
◉Early detection of toxicity improves safety outcomes.
Predictive Modeling of Outcomes
◉ML models simulate therapy responses before full-scale trials.
◉Assists in dose optimization and trial design efficiency.
Data Management & Analytics
◉AI integrates genomic, clinical, and imaging datasets for precise insights.
◉Helps reduce data redundancy and accelerates regulatory submissions.
Cost & Time Reduction
◉By automating repetitive tasks, AI reduces operational costs significantly.
◉Trial timelines shortened, ensuring faster time-to-market.
Enhanced Regulatory Compliance
◉AI tools standardize reporting formats, improving communication with FDA/EMA.
◉AI audit trails strengthen transparency for compliance.
Regional insights
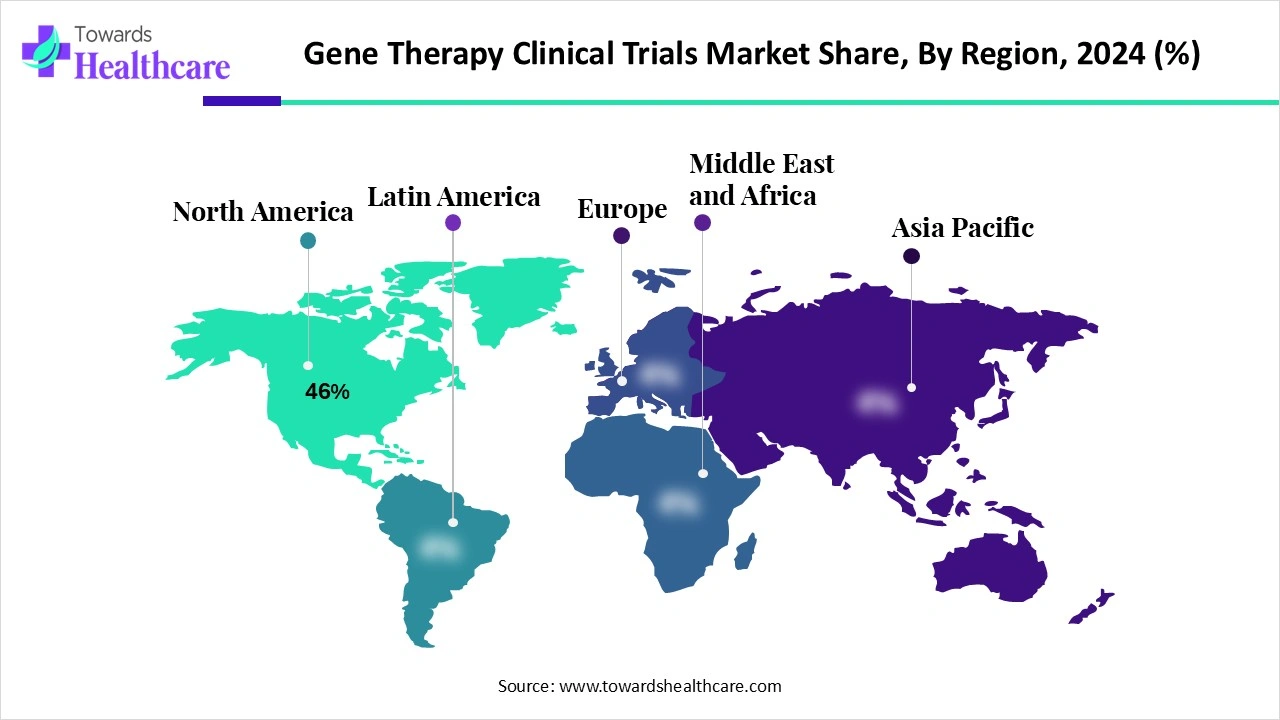
North America — deep analysis (46% share, 2024)
A. Market drivers & demand
◉Concentration of capital and sponsors. The region’s big share (46%) reflects dense venture/industry funding and major sponsor headquarters (Big Pharma + many biotech leaders), which accelerates pipeline financing and trial launches. Example: U.S. startups raised $304.5M in Q1 (source data).
◉High unmet-need therapeutic focus. Strong oncology, neurology and rare-disease programs attract gene therapy R&D because payers and health systems are accustomed to funding high-cost specialty medicines.
B. Clinical & trial infrastructure
◉Mature trial site network. High population of academic medical centers and specialized pediatric/neuro/oncology clinics able to run complex CGT protocols (manufacturing coordination, apheresis, intrathecal/retinal procedures).
◉Logistics and CDMO ecosystems. Local manufacturing vendors, cryo-logistics, and specialty pharmacies support on-time delivery and chain-of-identity — enabling faster Phase I→III scaling.
◉Operationally ready for large trials. ASGCT reporting 79 trials initiated in a quarter signals capacity to absorb new studies rapidly.
C. Regulatory & payer environment
◉Regulatory clarity and precedent. FDA approvals and established accelerated pathways for ATMPs (e.g., RMAT, BLA/accelerated approvals) shorten time-to-market for successful candidates.
◉Payer expectations and HTA activity. While payers accept higher prices for curative therapies, they demand durable evidence — driving sponsors to build long-term follow-up (LTFU) cohorts and health economic models early.
D. Manufacturing & CMC readiness
◉Scale & redundancy. North America has the largest concentration of commercial-scale vector and cell manufacturing capacity (viral vector CDMOs, CAR-T fill/finish), reducing risk of supply bottlenecks for late-stage trials.
◉Quality/regulatory alignment. Established GMP infrastructure with experience meeting FDA inspection expectations reduces CMC-related delays.
E. Talent & skills
◉Clinical expertise. High density of clinicians experienced in surgical delivery (intravitreal, intrathecal) and apheresis teams for ex vivo therapies.
◉Specialized roles. Experienced clinical operations, regulatory, CMC scientists, and pharmacovigilance professionals make program execution smoother.
F. Commercial readiness & ecosystem
◉Patient-identification networks. Registries, genetic screening programs, and advocacy groups enable faster enrolment for rare indications.
◉Early reimbursement pilots. Payer–manufacturer pilot agreements (outcomes-based or annuity models) are more feasible in North America due to sophisticated payer systems.
G. Strategic & competitive implications
◉Sponsor preference. Many developers launch pivotal US-focused registrational studies first to de-risk global filings.
◉Vendor consolidation. Logistics and CDMO vendors (e.g., specialty supply-chain companies) gain negotiating power due to demand concentration.
H. Risks & mitigations
◉Risk — Pricing pressure & affordability debates. Mitigation: build robust long-term outcomes and cost-effectiveness models; engage payers early.
◉Risk — CMC scale-up delay. Mitigation: parallelize process validation and invest in contract manufacturing redundancy.
I. Short/Medium-term outlook
◉Continued dominance in trial share and approvals; North America will remain the launch priority for most sponsors but will increasingly outsource trials or manufacturing to APAC for cost and capacity reasons — creating integrated US–APAC trial footprints.
Europe
A. Market drivers & demand
◉Strong biotech clusters. Germany, UK, and France host leading biotech and academic centers, driving investigator-initiated and sponsor-led CGT trials.
◉Public funding & collaboration. EU and national schemes support translational research for rare diseases and CGT.
B. Regulatory environment & EMA role
◉ATMP regulatory pathway. The EMA’s Advanced Therapy Medicinal Product (ATMP) classification (example: OCU400 in 2025) provides predictable requirements (CMC, non-clinical, post-authorization monitoring) and often a clear path to conditional approvals or centralized marketing authorization across EU states.
◉Harmonized but complex environment. Centralized EMA approval simplifies pan-EU commercialization, but local HTA bodies (NICE, HAS, IQWiG) impose diverse reimbursement requirements.
C. Clinical & manufacturing capacity
◉Specialist centers. High concentration of specialized centers for ocular, oncology, and neurology trials.
◉Manufacturing footprint. Growing CDMO presence, particularly for viral vectors and cell therapy manufacturing in Germany, France, and the UK, though capacity still lags North America and APAC in absolute scale.
D. Reimbursement & market access
◉HTA-driven pricing. European payers emphasize cost-effectiveness and real-world evidence; market access strategies must include robust RWE and long-term benefit demonstration.
◉Managed entry agreements. Conditional reimbursement and outcomes-based contracts are common routes for expensive ATMPs.
E. Talent & collaboration
◉Academic collaborations. Strong translational links between universities and industry enable investigator-led trials and early-stage innovation.
◉Cross-border investigator networks. Pan-European consortia accelerate multicountry enrollment for rare-disease studies.
F. Risks & mitigations
◉Risk — Fragmented reimbursement landscape. Mitigation: tailor country-level HEOR packages and flexible pricing models.
◉Risk — Slower investment growth vs. US. Mitigation: access EU grants and public-private partnerships to bridge funding gaps.
G. Short/Medium-term outlook
◉Europe will remain a critical region for pivotal multi-country trials and follow-on approvals after U.S. readouts; success depends on early EMA engagement and pan-EU reimbursement strategies.
Asia-Pacific (fastest CAGR)
A. Market drivers & demand
◉Rapid capacity expansion. APAC’s rising share (Cencora noted APAC trial participation rose from 8% → 29% between 2013–2023) reflects aggressive investment by sponsors to leverage lower costs and growing patient pools.
◉Large patient populations. High absolute numbers of patients (e.g., oncology) and growing awareness/diagnosis for rare diseases make APAC attractive for both enrollment and market scale.
B. Country-level deep dives
China (494 registered trials as of Aug 2025)
◉Scale & speed. Large number of registered trials reflects robust domestic biotech growth and approval pathways that encourage local development.
◉Manufacturing ambition. Significant investment in vector/cell manufacturing capacity — China is becoming a global CGT manufacturing hub.
◉Regulatory evolution. Faster clinical pathway reforms and increased domestic regulator experience with ATMPs facilitate trial starts.
India (24 registered trials; homegrown cancer gene therapy launched 2024)
◉Emerging ecosystem. Lower trial costs and growing local scientific talent, but smaller absolute trial numbers compared to China.
◉Policy push. “Make in India” and Atmanirbhar Bharat programs accelerate indigenous development and local manufacturing.
◉Clinical challenges. Limited number of highly specialized trial centers and need for capacity building in apheresis, GMP manufacturing, and long-term follow-up.
Japan & South Korea
◉Advanced infrastructure + regulatory alignment. Focus on high-quality data and global collaborations; strong cell therapy ecosystems (especially in Korea) and conservative but structured approval processes (Japan has conditional/accelerated pathways).
C. Logistics & operational considerations
◉Growing CDMO network. Rapid build-out of local vector and cell manufacturing reduces lead times and cold-chain shipping across APAC.
◉Site readiness variability. While metropolitan centers are ready for complex CGT trials, many countries/regions still lack specialized facilities — sponsors must carefully select sites.
D. Regulatory & ethical landscape
◉Heterogeneous regulations. Regulatory maturity varies widely; sponsors must navigate country-specific rules on genetic manipulation, patient consent, and LTFU obligations.
◉Emerging harmonization pressure. As more global studies run in APAC, there will be pressure for more harmonized data standards and audit readiness.
E. Commercial & market access
◉Cost-sensitive markets. While absolute patient numbers are large, payer systems vary — commercial pricing strategies must be regionally tailored.
◉Local manufacturing advantage. Domestic manufacturing can reduce unit cost and support regional pricing strategies.
F. Risks & mitigations
◉Risk — Regulatory divergence & unknowns. Mitigation: early engagement with local regulators and use of local regulatory consultants.
◉Risk — Supply-chain fragility in cross-border logistics. Mitigation: localize manufacturing and build regional redundancy (multiple CDMO partners).
G. Short/Medium-term outlook
◉APAC will capture an increasing share of clinical trials and manufacturing capacity. China will be the dominant APAC hub; India will grow faster from a smaller base if infrastructure investments (GMP, apheresis centers) scale quickly.
Latin America & Middle East & Africa (MEA)
A. Market drivers & demand
◉Early-stage adoption. Brazil and a few MEA countries (UAE, Saudi Arabia) are beginning to host trials and invest in CGT to address rare disease and oncology burdens.
◉Strategic government initiatives. Select nations pursue biotech ambitions to attract foreign investment and build domestic capabilities.
B. Clinical & manufacturing capacity
◉Limited but growing. Major metros (São Paulo, Mexico City, Dubai, Riyadh) can host complex trials, but the number of highly specialized centers is low relative to NA/EU/APAC.
◉Outsourced models. Sponsors may rely on regional hubs (e.g., Brazil for LATAM, UAE for MEA) rather than broad multination trial footprints.
C. Regulatory & access considerations
◉Evolving frameworks. Regulators in LATAM and MEA are updating policies to handle ATMPs; however, timelines may be slower and requirements differ.
◉Reimbursement constraints. Public health budgets and HTA capacity limit access to high-cost gene therapies without special financing mechanisms.
D. Opportunities & partnerships
◉Public–private partnerships. Large-scale investments in genomics centers and training programs can rapidly raise capacity.
◉Niche regional trials. For specific genetic variants more prevalent locally, region-specific trials can be efficient.
E. Risks & mitigations
◉Risk — Limited patient follow-up infrastructure. Mitigation: deploy remote monitoring, partner with local centers of excellence, and use central data platforms.
◉Risk — Reimbursement hurdles. Mitigation: outcome-based contracts, tiered pricing, and donor/charitable funding for ultra-rare conditions.
F. Short/Medium-term outlook
◉LATAM and MEA will remain secondary markets for trial initiation but will gain importance for regional access strategies and specialty collaborations; local capacity growth depends heavily on targeted investments and international partnerships.
Cross-regional themes & strategic implications
A. Supply-chain & logistics integration
◉Global sponsors will orbitalize trials: use North America/EU for regulatory pathing and APAC for scale/efficiency; logistics vendors (like Cencora) will be pivotal in orchestrating cross-regional supply chains.
B. Regulatory convergence & multi-region filings
◉Strategy: Sponsors should plan for staggered yet synchronous data packages: pivotal data to FDA/EMA with parallel registrational programs in APAC where feasible, leveraging regional regulatory classifications (e.g., ATMP).
C. Talent & capacity building
◉Investment need: APAC and emerging markets must invest in trained clinicians, GMP techs, and pharmacovigilance staff to sustain growth; sponsors should budget for on-site training and QA oversight.
D. Market-access & pricing strategies
◉Localized approaches: Use health-economic dossiers in EU/NA, affordability mechanisms in APAC/MEA/LATAM (tiered pricing, annuities, outcomes-based payments).
E. Risk management
◉Diversification: Mitigate geopolitical/regulatory risk by diversifying manufacturing sites and establishing redundant logistics pathways.
Market Dynamics
Drivers
◉Rising prevalence of genetic & rare disorders.
◉Government initiatives and funding.
◉Growing demand for personalized medicine.
◉FDA approval of 46 cell & gene therapy products by Aug 2025.
Restraints
◉Lack of accessibility in rural regions.
◉Shortage of trained professionals in emerging markets.
Opportunities
◉CRISPR-Cas9 & prime editing revolutionizing precision therapies.
◉AI and genomic databases enabling customized trial designs.
◉Expanding pipelines in oncology, neurology, and ophthalmology.
Top Companies
Novartis
◉Products: Zolgensma, CAR-T therapies.
◉Strength: First-mover advantage, global leadership in approvals.
Roche/Genentech
◉Products: Oncology-focused pipeline, gene-targeted drugs.
◉Strength: Global reach, strong oncology expertise.
Pfizer
◉Products: Broad CGT pipeline, AAV vector innovation.
◉Strength: Financial capacity, global trials network.
Biogen
◉Products: CNS therapies, partnership with Stoke Therapeutics.
◉Strength: Deep neurology expertise.
Regeneron
◉Products: Immunology and oncology gene therapy pipeline.
◉Strength: Strong R&D base.
Sarepta Therapeutics
◉Products: Neuromuscular disorder therapies.
◉Strength: FDA-approved therapies for DMD.
Bluebird bio
◉Products: Zynteglo, Skysona.
◉Strength: Experience in rare genetic diseases.
CRISPR Therapeutics, Intellia, Editas, Beam, Verve, Sana
◉Products: CRISPR-based therapies, ex vivo editing.
◉Strength: Next-gen genome editing technologies.

Get a Sample of this Report
Gene Therapy Clinical Trials Market