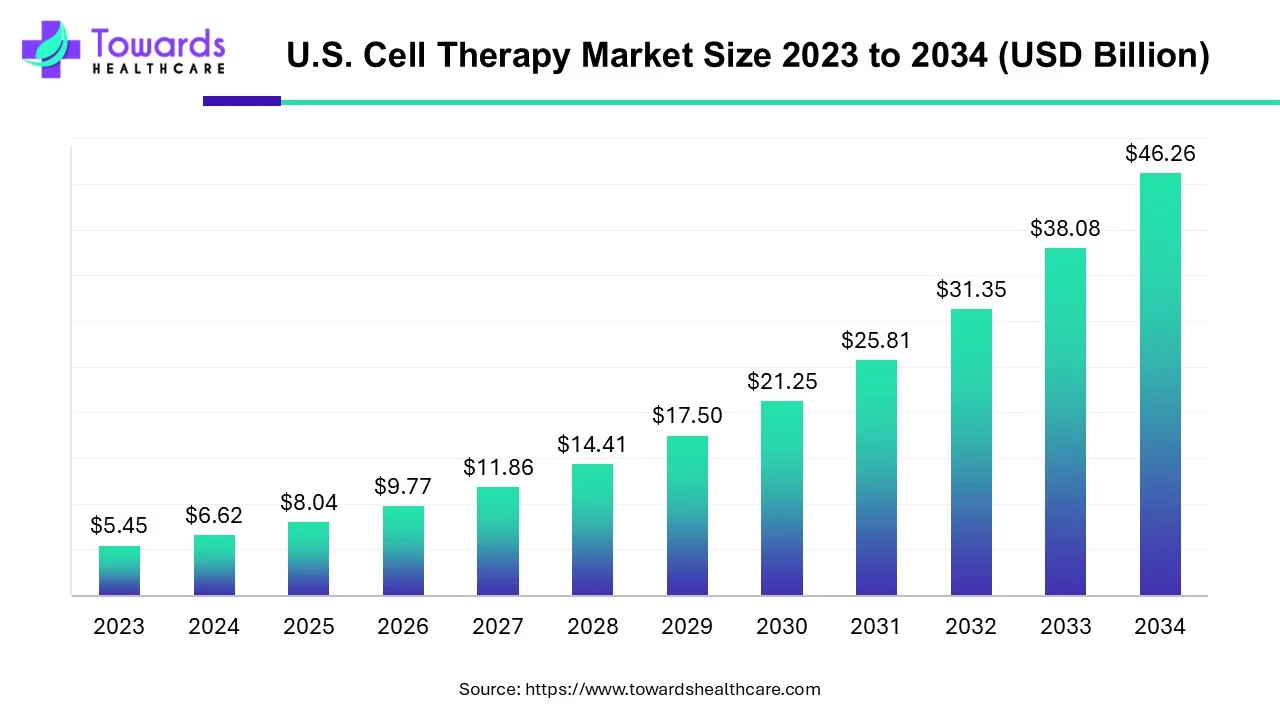
The U.S. cell therapy market size is forecast to grow at a CAGR of 21.46%, from USD 8.04 billion in 2025 to USD 46.26 billion by 2034, over the forecast period from 2025 to 2034.
Download the free sample and get the complete insights and forecasts report on this market @ https://www.towardshealthcare.com/download-sample/5159
Market size
U.S. market — yearwise (billions USD)
●2024: 6.62 (given)
●2025: 8.04 (given)
●2026: 9.77 (projected, CAGR applied)
●2027: 11.86
●2028: 14.41
●2029: 17.50
●2030: 21.25
●2031: 25.81
●2032: 31.35
●2033: 38.08
●2034: 46.26 (report target)
Global market — yearwise (billions USD)
●2025: 7.21 (given)
●2026: 8.82
●2027: 10.80
●2028: 13.21
●2029: 16.17
●2030: 19.79
●2031: 24.22
●2032: 29.64
●2033: 36.27
●2034: 44.39 (report target)
Market trends
●Autologous dominance (2023): autologous therapies dominated in 2023 because personalized, patient-sourced products (e.g., autologous CAR-T, autologous skin grafting, platelet-rich plasma) reduce immune-rejection risk and fit well into existing clinical workflows — this contributed to earlier revenue concentration in autologous products.
●Allogeneic fastest growth (forecast): allogeneic approaches (off-the-shelf cells from donors/iPSC sources) are forecast to grow fastest due to easier scaling, standardization, and the promise of lower per-patient cost once manufacturing is industrialized.
●Oncology remains the primary therapeutic anchor: oncology led in 2023 and is expected to remain dominant due to approved CAR-T products and a deep pipeline of hematologic and solid-tumor cell therapies.
●Clinical evidence accelerating (Apr 2025 signals): multiple April 2025 reports (Parkinson’s stem-cell trials in Nature; MD Anderson AIC100 safety/efficacy signals; new CAR-T CD30 therapy HSP-CAR30 showing durable responses; USC EchoBack CAR T activation technology) signal rising clinical validation which catalyzes investment and adoption.
●Manufacturing and platform innovation (example — Cytiva Sefia): platform solutions like Cytiva’s Sefia (with Kite/Gilead collaboration) are intended to reduce time and cost to make CAR-T and cell products — platformization is a major trend enabling scale.
●“Activation-on-demand” & local activation tech: technologies such as the EchoBack CAR T (ultrasound-activated) emphasize spatially-restricted activation to reduce off-tumor toxicity and improve safety profiles — this trend improves tolerability and broadens indications.
●Off-the-shelf product push: vendors and academic groups (e.g., trials of allogeneic T products and off-the-shelf PRP for veterinary use) indicate market appetite for standardized, inventory-based products.
●Expanded indications beyond oncology: neurological (Parkinson’s), regenerative and autoimmune indications are moving into trials — broadening TAM (total addressable market).
●Commercial & distribution expansion: specialty pharmacy and distribution moves (Walgreens Specialty Pharmacy) show commercialization/administration models evolving to support cell therapy logistics and payer engagement.
●Cost pressure & payer scrutiny: cell therapies remain expensive (>US$400k to >US$1M per patient), constraining access and pushing industry to pursue manufacturing cost reductions and novel reimbursement models.
AI will impact / play a role in the U.S. cell-therapy market
Automated process optimization (manufacturing yield & cost reduction)
●AI (ML models + real-time process analytics) tunes culture conditions, feed schedules and bioreactor parameters to maximize cell expansion/yield, shorten run times and reduce consumable use.
●Impact: lowers per-dose cost and addresses the “high cost of cell therapy” restraint you noted.
Predictive quality control & early failure detection
●Multimodal models (spectroscopy, imaging, process sensors) predict batch failures early, enabling early intervention or stop decisions, improving overall success rates and saving expensive downstream steps.
●Impact: reduces wasted runs and regulatory complications from out-of-spec lots.
Digital twins for scale-up and facility design
●Create virtual replicas of manufacturing runs to test scale/hardware changes in silico before committing to expensive GMP runs.
●Impact: accelerates platform adoption (e.g., Cytiva Sefia) and reduces capital risk.
Image-based cell phenotyping & potency assays
●Deep learning on microscopy/flow cytometry images automates phenotype classification, potency scoring, and detection of unwanted subpopulations (e.g., exhausted T cells).
●Impact: objective, faster release assays and improved batch consistency.
Optimizing CAR/TCR design and off-target prediction
●Generative models and in-silico screening propose optimized CAR constructs with predicted binding, signaling strength and minimized cross-reactivity.
●Impact: speeds preclinical design and reduces clinical failure risk.
Patient-matching & responder prediction
●Clinical ML models combining genomic, tumor, and immunophenotype data predict which patients are likely to respond or experience toxicity, enabling better trial stratification and payer negotiation.
●Impact: improves trial success rates and value proposition for payers.
Automated regulatory documentation & submission support
●NLP systems compile batch records, generate traceability reports, and prepopulate regulatory templates to accelerate IND/BLAs and QA audits.
●Impact: reduces administrative time and inspection risk.
Supply-chain forecasting and cold-chain optimization
●Predictive analytics optimize scheduling for apheresis, manufacturing slots, and cryo-logistics to minimize hold times and product loss.
●Impact: increases throughput and reduces logistics costs for autologous flows.
Clinical trial design & synthetic control arms
●AI helps find historical patients for synthetic controls, optimizes adaptive trial designs, and simulates population responses to improve trial efficiency.
●Impact: faster trials and lower development cost.
Real-world evidence (RWE) generation & post-market safety surveillance
●ML ingests EHRs, claims and registries to detect rare adverse events, durability signals, and long-term effectiveness—critical for payers and label expansions.
●Impact: supports reimbursement and label broadening, addressing long-term value concerns.
Regional insights (U.S.)
West Coast (California, Pacific Northwest)
●Research & clinical trial density: presence of UC San Diego (Alpha Stem Cell Clinic), numerous academic centers leads to early clinical trial activity and translational pipelines.
●Manufacturing & talent: strong cell-therapy process development talent; proximity to instrumentation and biotech vendors.
●Regulatory & commercialization support: biotech-friendly investor community and access to contract development/manufacturing (CDMO) partners.
Northeast (Boston / New England – implied)
●Dense VC & pharma partnerships: large concentration of biotech capital and strategic pharma partners accelerates early-stage companies and licensing deals.
●Clinical networks: prominent academic hospitals provide trial sites and translational research.
South (Atlanta, Texas, Southeastern hubs)
●Increasing clinical & transplant capacity: City of Hope Atlanta launch shows satellization of transplant/cell therapy programs into new regions, increasing procedural capacity for autologous transplants and CAR-T administration.
●Cost and access implications: expanding regional centers reduce patient travel burdens and broaden access to specialty care.
Midwest
●Manufacturing & logistics advantages: lower real estate/labor costs make the Midwest attractive for large-scale GMP facilities and distribution centers (cold chain).
●Workforce pipelines: technical workforce from regional universities supports manufacturing staffing.
Commercial logistics & specialty pharmacy coverage (nationwide)
●Specialty pharmacy expansion (Walgreens): national pharmacy chains building specialty capabilities facilitate reimbursement navigation, infusion/administration coordination, and patient support programs.
●Payer fragmentation across states: regional differences in Medicaid programs and private plans mean market uptake can be uneven — companies must build state-level market access strategies.
Market dynamics
Primary drivers
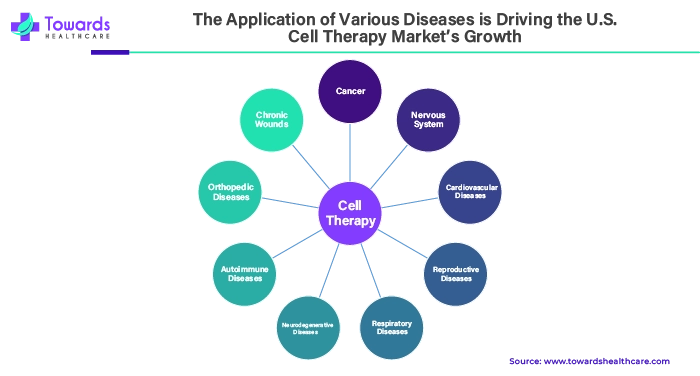
●High disease burden & unmet needs: cardiovascular disease, neurodegenerative diseases, autoimmune disorders and cancer present large patient pools (e.g., Alzheimer’s estimate 6.2M; Parkinson’s ~1M; autoimmune disorders up to 50M in US).
●Clinical validation in multiple indications: successful CAR-T approvals and the April 2025 trial signals in Parkinson’s and thyroid cancer expand clinical confidence.
●Platform & manufacturing innovations: systems like Cytiva’s Sefia and G-Rex manufacturing grants (Sidra Medicine) lower time-to-manufacture and open capacity.
Major restraints
●High per-patient cost and reimbursement pressure: typical prices >US$400k and sometimes >US$1M create payer resistance and access bottlenecks.
●Complex multi-step manufacturing (leukapheresis → genetic engineering → expansion → QC): cost, time and skilled labor requirements increase failure points and limit throughput.
Opportunities
●Allogeneic/off-the-shelf commercialization: scalable inventory models that reduce turnaround time and cost per dose.
●Expanded non-oncology indications (neuro, cardiac, autoimmune): large TAM if durable efficacy is shown.
●Partnerships between CDMOs, pharma and tech firms: accelerate adoption of standardized manufacturing platforms.
Threats & challenges
●Supply chain & raw material constraints: viral vectors, culture media and specialized disposables can constrain capacity and raise costs.
●Regulatory & manufacturing harmonization lag: inconsistent standards across facilities increase QA burden.
●Competition & pricing pressure: as off-the-shelf options emerge, price competition could compress margins.
Quantitative context
●U.S. market growth: from USD 6.62B (2024) to USD 46.26B (2034) at CAGR 21.46% (2025–2034) — indicates a large absolute expansion and investment opportunity despite current cost restraints.
●Oncology dominance: oncology already dominated 2023 and remains central to near-term commercial returns (CAR-T therapies and follow-ons).
Top 10 companies 
Aurion Biotech
●Overview: cell-therapy biotech (listed by you among top players).
●Products/pipeline: (not detailed in supplied content).
●Strength: early-stage innovation focus; likely nimble R&D capabilities.
Vertex Pharmaceuticals Incorporated
●Overview: large biopharma with strong 2024/2025 financial performance (you reported revenue growth).
●Products/pipeline: Vertex reported revenue growth and targets in 2025; active in cell/gene partnerships.
●Strength: strong corporate resources, proven commercialization experience and cash runway to support cell-therapy investments.
Cellular Biomedicine Group, Inc.
●Overview: cell therapy company (on your list).
●Products/pipeline: (not specified in content).
●Strength: cell therapy R&D focus and likely manufacturing experience in specific niches.
Nkarta, Inc.
●Overview: NK-cell engineering company (clinical-stage).
●Products/pipeline: financials reported (marketable securities $380.5M as of 31 Dec 2024); R&D/G&A expense figures provided.
●Strength: engineered NK platform, solid cash runway to progress clinical programs.
Atara Biotherapeutics, Inc.
●Overview: allogeneic T-cell / EBV T-cell platform specialist (detailed pipeline supplied).
●Products/pipeline: Tab-cel® (EBV+ PTLD); ATA3219 (allogeneic anti-CD19 CAR-T memory phenotype); ATA3431 off-the-shelf CD19/CD20 program (IND target H2 2025); ATA188 for EBV-infected B cells (MS focus).
●Strength: deep allogeneic T-cell platform, multiple programs across oncology & autoimmune — clear R&D pipeline and regulatory path planning.
Johnson & Johnson
●Overview: global pharmaceutical/device conglomerate with cell therapy investments.
●Products/pipeline: broad innovative medicines portfolio; Q2 2025 adjusted EPS and revenue data reported (sales $23.74B).
●Strength: enormous commercialization capability, global infrastructure, payer relationships and capital to scale therapies.
CARGO Therapeutics, Inc.
●Overview: (listed) presumed cell therapy biotech.
●Products/pipeline: (not specified in provided content).
●Strength: niche R&D capabilities; potential platform or cell engineering technology.
Bristol-Myers Squibb Company
●Overview: major oncology player with cell/gene investments and marketed cancer drugs.
●Products/pipeline: (not detailed here).
●Strength: extensive oncology development & commercialization expertise; ability to integrate cell therapies into combination regimens.
Selecta Bioscience
●Overview: specialty biotech focusing on immune-modulation/delivery (not fully described in the supplied text).
●Products/pipeline: (not detailed).
●Strength: platform technologies for immune tolerance / delivery that can be complementary to cell therapies.
Gilead Sciences, Inc.
●Overview: large biopharma with Kite (CAR-T) heritage and multiple CAR programs listed (KITE-197, KITE-753, KITE-363, iMMagine-1, ZUMA programs).
●Products/pipeline: detailed list in your content: multiple CD19, CD19/CD20, BCMA, and ZUMA series programs spanning Ph1–Ph3.
●Strength: established CAR-T commercialization (Yescarta, Tecartus lineage via Kite), product portfolio scale, manufacturing partnerships (e.g., collaborations mentioned with Cytiva/Kite).
Latest announcements
August 2025 — Sidra Medicine & G-Rex® Grant
●What: $100,000 G-Rex® Grant to Sidra Medicine; aim to accelerate pediatric oncology GMP protocols and provide a cell manufacturing platform optimized for T-cell phenotypes.
●Implication: targeted grants and facility investments speed pediatric CAR/T manufacturing capability and reduce time-to-clinic for vulnerable populations.
July 2025 — Johnson & Johnson Q2 results
●What: Adjusted EPS $2.77, revenue $23.74B (up 5.8% YoY); innovative medicines sales up ~4.9% (operational).
●Implication: strong balance sheet and cash flow support J&J’s investments in advanced therapies and potential partner deals.
March 2025 — Nkarta Q4/Full-year financials
●What: Marketable securities $380.5M; R&D and G&A expense details for 2024.
●Implication: Nkarta has runway/support to continue clinical development of engineered NK programs.
Feb 2025 — Vertex FY results
●What: Revenue growth (15.2% Q4; 16.5% FY) and forward revenue targets; strong operational cash flow.
●Implication: Vertex’s capital strength supports investments in cell/gene partnerships and potential pipeline expansion.
April 2025 — Multiple academic/clinical results
●Parkinson’s stem-cell trials (Nature): two independent clinical trials using hESC and hiPSC derivatives reported safe/effective signals for Parkinson’s — signals open neurodegenerative indications.
●UC Irvine lab-grown microglia: researchers generated microglia from stem cells that clear toxic brain buildup in mice and restored memory—supports future CNS cell therapies.
●MD Anderson AIC100 (thyroid cancer): acceptable safety and meaningful responses in advanced thyroid cancer patients — expands CAR-T reach beyond hematologic malignancies.
●HSP-CAR30 (CD30 targeting) (Blood): Phase I shows high efficacy/durable responses in refractory CD30+ lymphoma — promising for antigen-specific CAR-T.
●USC EchoBack CAR T: ultrasound-activated CAR-T that restricts activation to tumor area — reduces off-target effects.
June 2024 — Cytiva Sefia platform (with Kite/Gilead collaboration)
●What: next-generation manufacturing platform to accelerate and reduce cost of CAR-T and other cell products.
●Implication: platform adoption is a structural enabler for industry scale.
March 2024 — Walgreens Specialty Pharmacy launch & Seattle Children’s IND
●What: Walgreens expands specialty services (gene & cell therapy readiness). Seattle Children’s receives FDA permission for a first-in-country CAR-T trial in pediatric lupus.
●Implication: distribution & clinical site readiness progress—improves access and trial diversity.
Nov 2022 — UC San Diego Alpha Stem Cell Clinic funding (CIRM $8M)
●What: state funding to expand stem cell therapy readiness.
●Implication: public investment in clinic infrastructure supports translational research.
Recent developments
●Clinical proof points in neurology & thyroid cancer (Apr 2025) broaden the potential indications beyond hematologic oncology.
●Manufacturing platforms & grants (Cytiva Sefia; Sidra G-Rex grant) point to investment into scalable manufacturing and pediatric capacity.
●Commercial readiness moves by pharmacy chains (Walgreens) and new transplant programs (City of Hope Atlanta) are expanding administration and access infrastructure.
●Company financials (J&J, Vertex, Nkarta) show incumbents and mid-caps have capital to fund development and commercialization.
●Regulatory and trial expansion (Seattle Children’s pediatric CAR-T IND) shows regulators and academic centers supporting novel trials in underserved groups.
Segments covered
By Therapy Type — segments & subpoints
Allogeneic therapies
●Sources: donor tissues, umbilical cord, placenta, iPSC.
●Advantages: off-the-shelf, faster administration, potential lower per-patient cost at scale.
●Challenges: immune rejection, need for immune-evasive engineering, HLA mismatches, regulatory safety proof.
●Market implication: fastest CAGR segment (per your content) — key to scaling the market.
Stem cell therapies
●Hematopoietic stem cell therapies (HSC): well-established (bone marrow transplants) — backbone of cytotherapy experience.
●Mesenchymal stem cell therapies (MSC): immunomodulatory uses, regenerative claims — broad potential but variable clinical evidence.
●Manufacturing & potency: heterogeneity of MSCs complicates standardization and regulatory acceptance.
Non-stem cell therapies (keratinocytes & fibroblast-based, others)
●Use cases: dermatology, wound healing, reconstructive procedures.
●Regulatory path: often local-application focused, different safety/efficacy expectations than systemic cells.
Autologous therapies
●T-cell therapies (incl. CAR-T): personalized, lower rejection risk, but complex logistics (leukapheresis → manufacturing → infusion).
●TCR-based & others: targeted for intracellular antigens, increasingly used in oncology.
By Therapeutic Area — segments & subpoints
●Oncology (dominant)
●Products: CAR-T, TCR therapies, adoptive cell transfer.
●Value proposition: high clinical benefit in certain patients, commanding premium pricing; foundation of near-term commercialization.
Dermatology
●Products: keratinocyte grafts, fibroblast products, regenerative patches.
●Market: procedural/regenerative niche with lower unit price but high volume potential.
Others
●CNS (Parkinson’s, Alzheimer’s), cardiovascular, autoimmune, orthopedics: expanding R&D activity; higher technical complexity and potentially larger population impact if efficacy proven.
Top 5 FAQs
Q1: What is the projected size of the U.S. cell-therapy market by 2034?
A: USD 46.26 billion by 2034 (report projection; CAGR 21.46% from 2025–2034; 2024 baseline USD 6.62B).
Q2: Which therapy type dominated in 2023 and which will grow fastest?
A: Autologous therapies dominated in 2023; allogeneic therapies are estimated to grow at the fastest CAGR during the forecast period.
Q3: What therapeutic area drives the market?
A: Oncology dominated in 2023 and is expected to remain the primary revenue driver through the forecast period.
Q4: What are the main restraints limiting market growth?
A: High per-patient cost (often >US$400k to >US$1M), manufacturing complexity (leukapheresis → engineering → expansion → QC), and payer/reimbursement challenges.
Q5: Which companies are key players and what are some pipelines/products to watch?
A: Key players you listed include Aurion Biotech, Vertex, Cellular Biomedicine Group, Nkarta, Atara, J&J, CARGO Therapeutics, Bristol-Myers Squibb, Selecta, and Gilead. Notable pipelines from your content: Atara’s multiple allogeneic T programs (Tab-cel®, ATA3219, ATA3431, ATA188) and Gilead/Kite’s CD19 and CD19/CD20 programs plus ZUMA series.
Access our exclusive, data-rich dashboard dedicated to the therapeutic area sector – built specifically for decision-makers, strategists, and industry leaders. The dashboard features comprehensive statistical data, segment-wise market breakdowns, regional performance shares, detailed company profiles, annual updates, and much more. From market sizing to competitive intelligence, this powerful tool is one-stop solution to your gateway.
Access the Dashboard: https://www.towardshealthcare.com/access-dashboard
Immediate Delivery Available | Buy This Premium Research @ https://www.towardshealthcare.com/price/5159
Become a valued research partner with us – https://www.towardshealthcare.com/schedule-meeting
You can place an order or ask any questions, please feel free to contact us at [email protected]
Powering Healthcare Leaders with Real-Time Insights: https://www.towardshealthcare.com/healthcare-intelligence-platform
Europe Region – +44 778 256 0738
North America Region – +1 8044 4193 44
APAC Region: +91 9356 9282 04
Web: https://www.towardshealthcare.com
Find us on social platforms: LinkedIn | Twitter | Instagram | Medium | Pinterest